Back again with some more hot housing takes! A lot of folk around me are in the process of buying property or have recently done so. I’ve commonly heard about how hard the market is for buyers and, as a result, everything is going for so much above the list price.
That sounded strange to me– I imagine an efficient market would make list prices around what folk are willing to pay for it. I wanted to see if data backed that up, specifically testing my hypothesis:
The difference between a home’s sale price and it’s highest listing price is a normal distribution around $0.
Data
I went to Zillow for the source data, since they aggregate sale, listing, and change data from a variety of sources. Of course it’s not 100% complete, but I don’t need it to be perfect. Zillow unfortunately doesn’t provide an API for this data, and their website is structured difficultly for scraping. I got a little script going that worked most of the time. But needed to be babysat enough that I only got a few donzen data points before getting tired of running it.
const SOLD = 'Sold';
const LISTED = 'Listed for sale';
const CHANGED = 'Price change';
const states = [SOLD, LISTED, CHANGED]
const addresses = {};
let getData = (i, cards) => {
// End condition.
if (i >= cards.length) return;
// Click on current house card.
cards[i].click();
setTimeout(() => {
try {
// Pull its address.
const address = document.getElementById('ds-chip-property-address').textContent;
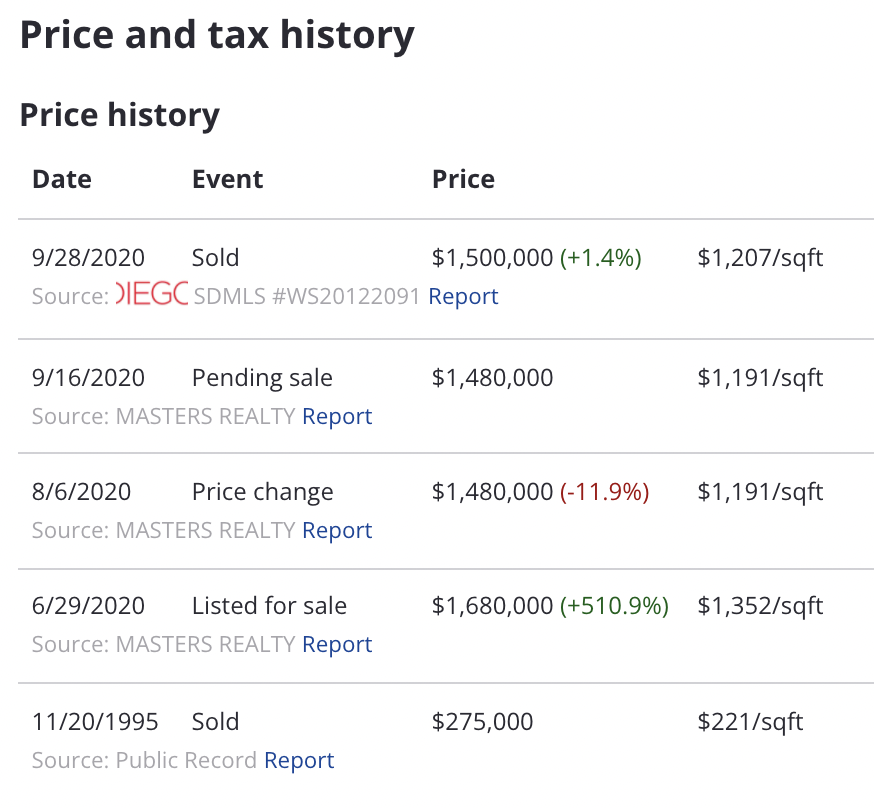
// Pull its pricing history.
const priceData = Array.from(document.getElementsByTagName('span'))
.filter(s => states.includes(s.innerHTML))
.map(s => ({
state: states.find(str => str == s.innerHTML),
// Price data has a common grandparent element.
price: s.parentElement.parentElement.innerHTML.match(/\$[0-9]{1,3}(?:,?[0-9]{3})+/)[0],
}));
// Log.
addresses[address] = priceData;
console.log('logged for', address);
} catch (e) {
console.log('skipped due to error:', e);
}
// Close the window.
document.getElementsByClassName('home-detail-lightbox-mask')[0].click();
setTimeout(() => {
// Recurse.
getData(i+1);
}, 1000);
}, 5000);
}
let start = () => getData(0, Array.from(document.getElementsByClassName('list-card')));
start();
The result was a list of addresses with their recent sale and listing prices.
Results
I scraped 34 single-family, detached home in the $800k-1.5M range in my neighborhood sold within the past ~month. Of those, 26 have both sold and listing data. I compared the last sold price with the highest listing price since its second most recent sale. The median home was sold for 4% less than its highest listing price. The 10th-percentile was 15% below listing, and the 90th-percentile was 13% above.
I also looked at the difference between the last sold price and the immediately preceding listing price. The median home was sold for exactly the same as the last listing price (10%ile: 7% below, 90%ile: 13% above).
Edit: This data is corroborated by Redfin, which publishes their own sale-to-list ratio. The ratio for my neighborhood is 98%, or the median sale price is 0.98x the median last-list price. Two notes about this:
- It’s very neighborhood-specific– my few blocks had a different value then a lightly broader definition, which was 100.3%. These are still pretty low sample-size sets.
- Redfin compares sale prices to the most recent list price. Above, I used the highest list price since the last sale, since that better captures the spirit of my hypothesis about homes selling for less than they (were once) asked. Redfin’s number will therefore favor sale price since the list price will be closer to a “realistic” number.
Conclusion
I was a little surprised to see that the median home sold for less than its highest list price. That makes sense in a market where negotiation is common– the seller asks for more than they expect since they know potential buyers can bargain down. Perhaps this agrees with the result where last-list (and last negotiated) price was roughly the same as sale price.
This is far from definitive, since the data set is only n=26 and does not consider anything else about the property. It’s possible that the folk I’ve heard from were only looking at homes that fall above the median in this distribution.
Tinfoil-hat-warning: I wonder if the idea that “all home sell above list” is created by realtors, who get paid more if homes sell at a higher price. It feels like the kind of popular vague-but-sounds-scientific idea that can easily be said without numbers to back it up.
Future Work
I’d definitely want to expand the data set to have more homes to back up the results’ statistical significance. These also only account for a limited type of home in a very small region of one city, so I’d broaden the search. Maybe I’ll spend a bit more time to babysit the scraper and come back to these results.
Until then, it gives comfort that my Zillow surfing is grouned a bit more in reality.